About
ImageDataExtractor is an open-source python package for automatically extracting quantitative data from microscopy images.
Check out the documentation to get started, or look below to see how it works.
Image Mining
Figure captions within scientific documents are first mined with ChemDataExtractor using keywords that identify possible microscopy images within them. If the corresponding Figures of the document are of the form of multiple image panels, these panels are then separated into their constituent images.
Figure Scraping
ImageDataExtractor uses ChemDataExtractor to automatically detect relevant images from within Figures of a given HTML or XML document.
Figure Splitting
Multi-panel images are separated using our two-step algorithm, by splitting on whitespace and integer fractions of the image.
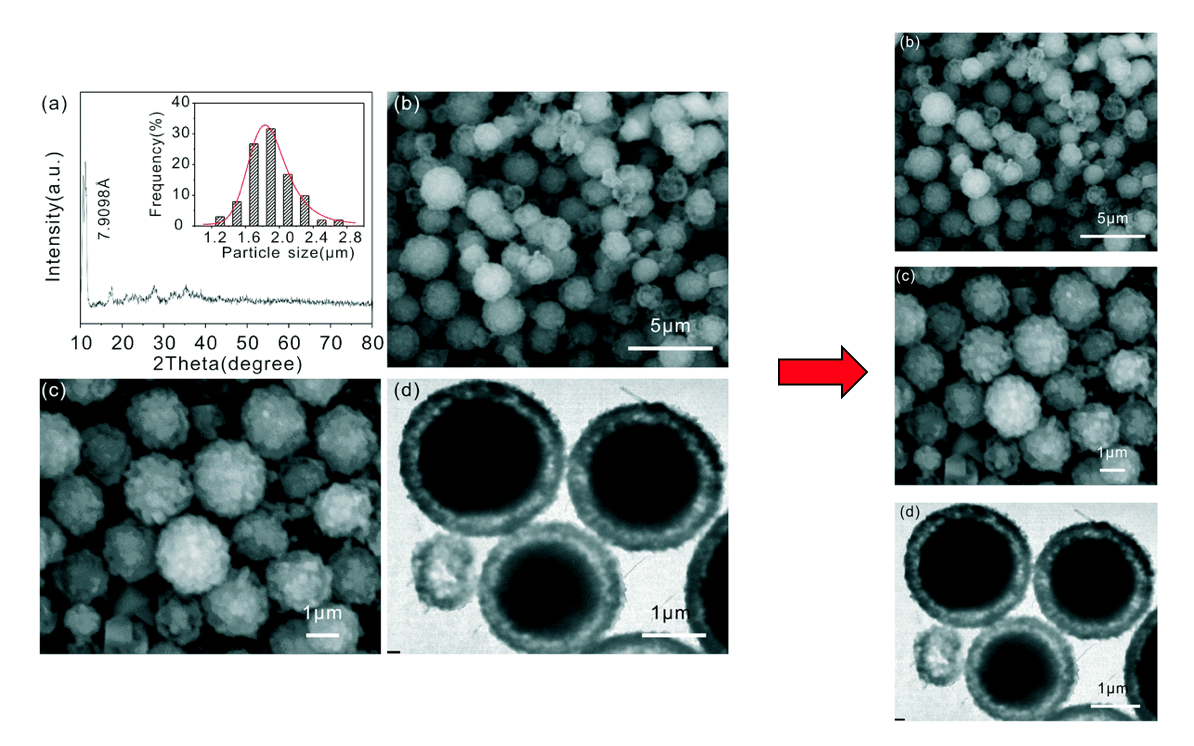
Particle Detection
Particle regions are identified and the scalebar's pixel/value ratio extracted.
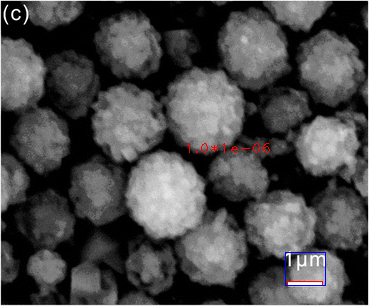
Scalebar Detection
Scalebar regions are located and the value and unit of the scale read using optical character recognition.
The number of pixels in the scalebar is used to calculate a scale mapping for the image.
Thresholding
The image is converted to greyscale and binarized using an adaptive thresholding algorithm
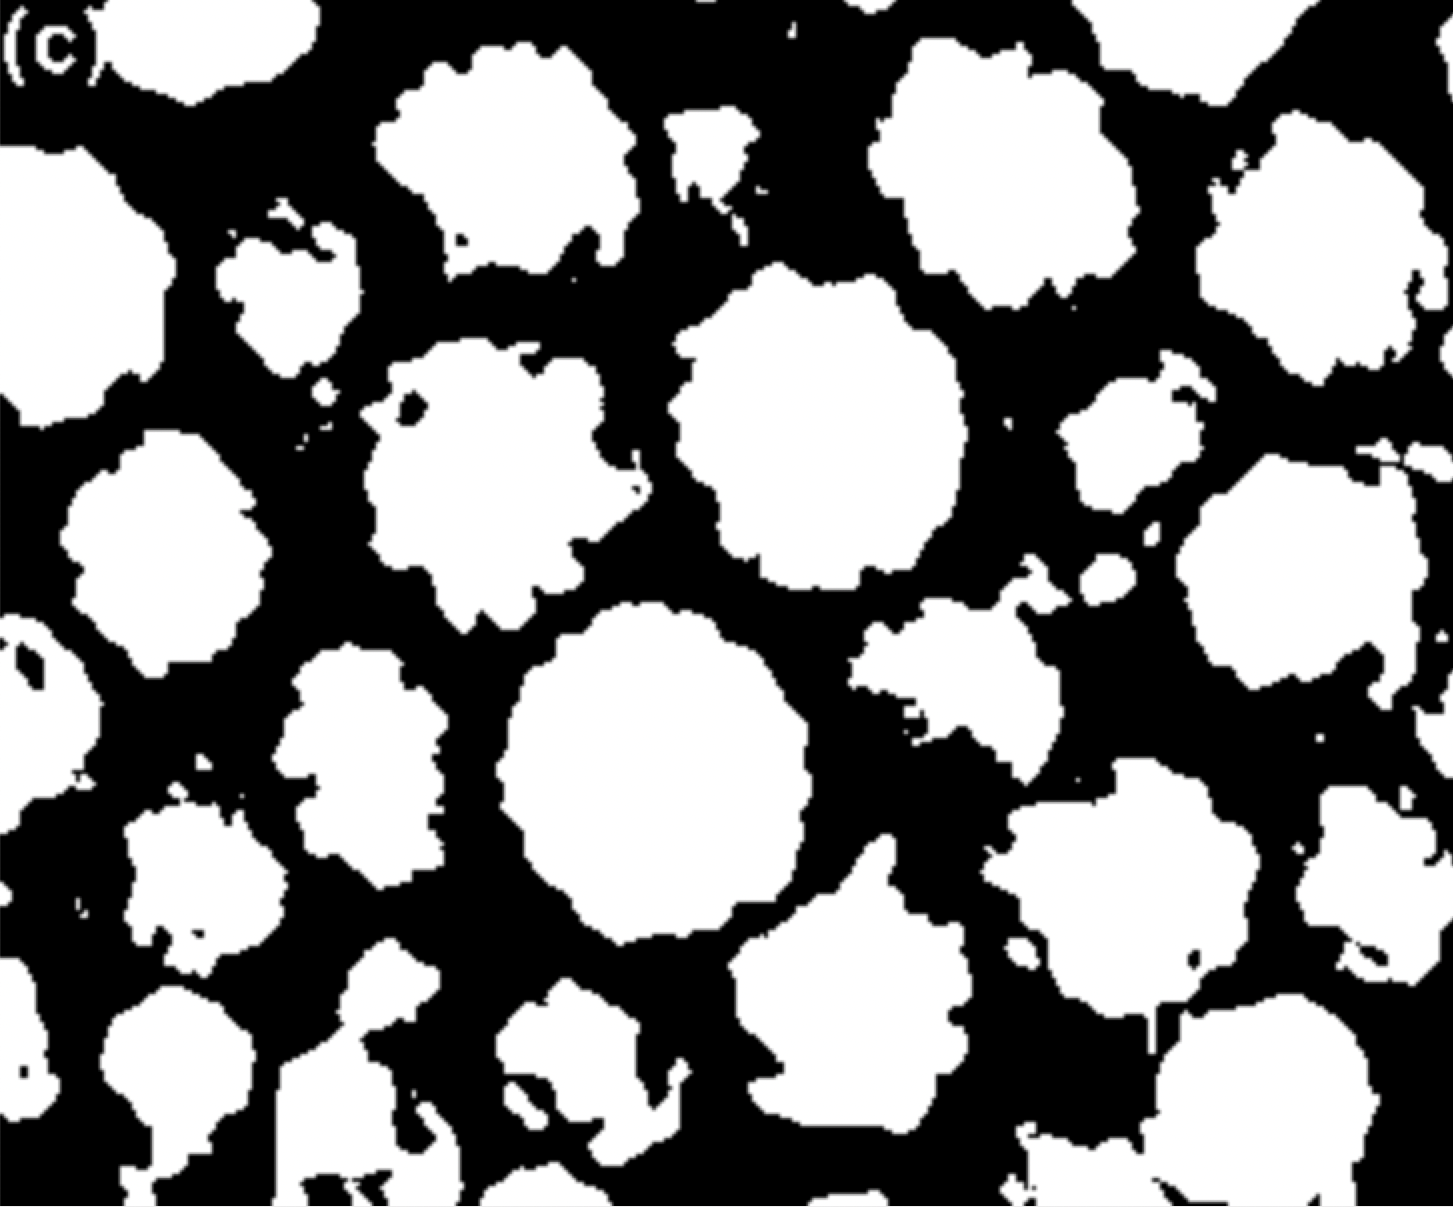
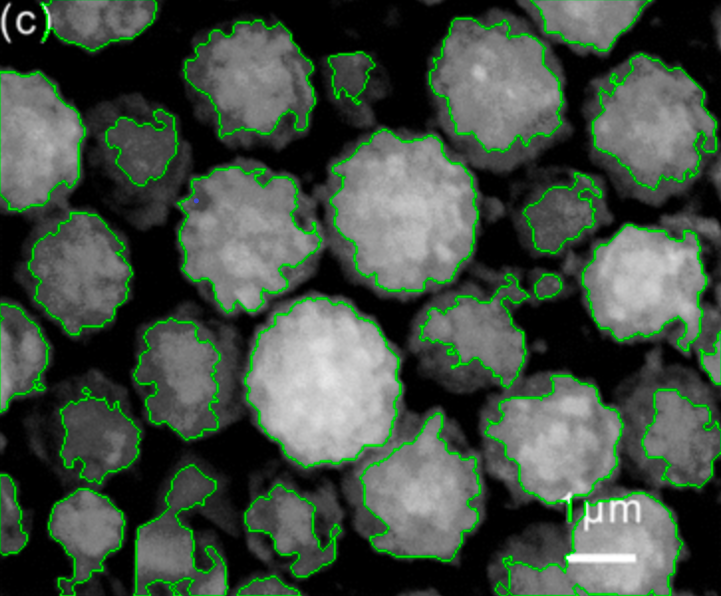
Contour Detection
Edge detection algorithms are used to identify all closed contours.
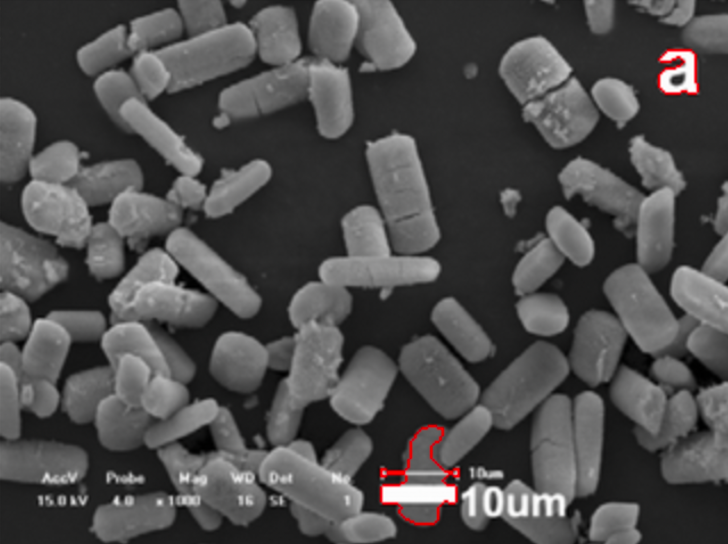
Remove False Positives
The contours are filtered by removing all contours with insufficient variation in pixel intensity.
A different image to the running example is used here due to the lack of false positives in the main example.
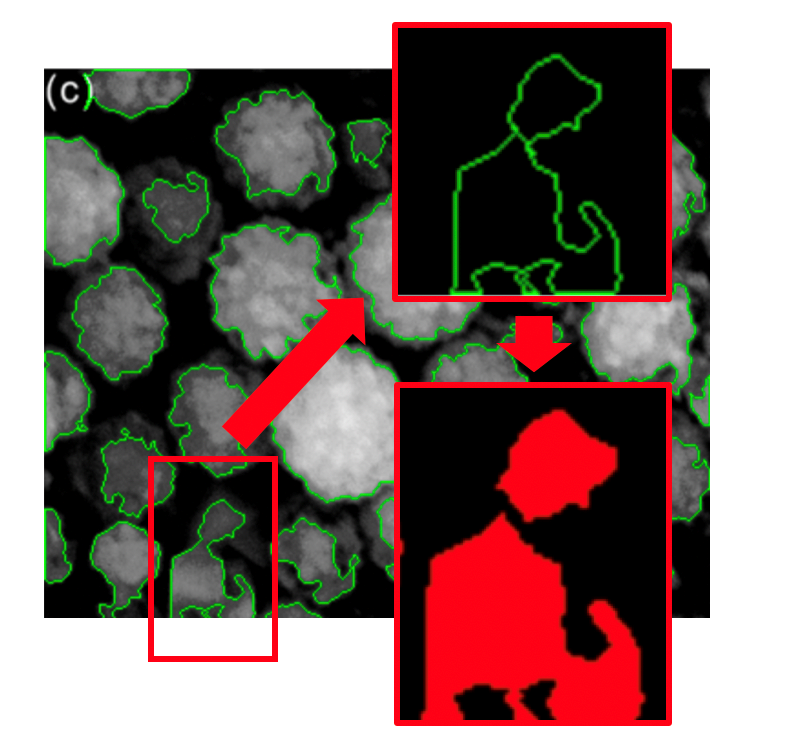
Cluster Break-Up
Contour bottlenecks are used to split nearby particles that were blurred together during the contour detection.
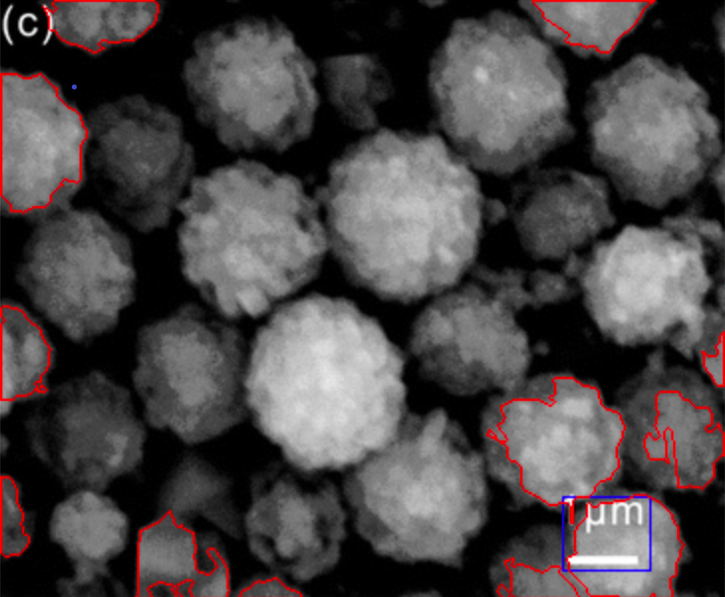
Contour Filtering
Contours intersecting the image borders or scale information region (blue rectangle) are eliminated for being artifically distorted.
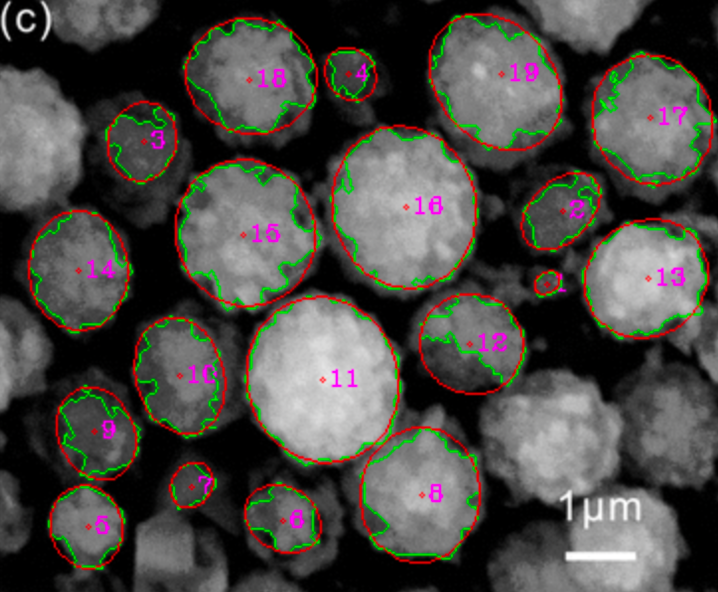
Ellipse Fitting
Remaining contours are fitted to an ellipse.
If it is determined that the ellipse is a better fit than the contour, it is used instead from this point forwards.
Particle Detection Output
After a secondary edge correction to remove ellipses intersecting the image border, the particle detection is complete and can be used to calculate the image metrics.

Calculate Metrics
Now that the extraction is done, let's look at the results!
ImageDataExtractor automatically generates useful graphics for easy interpretation.
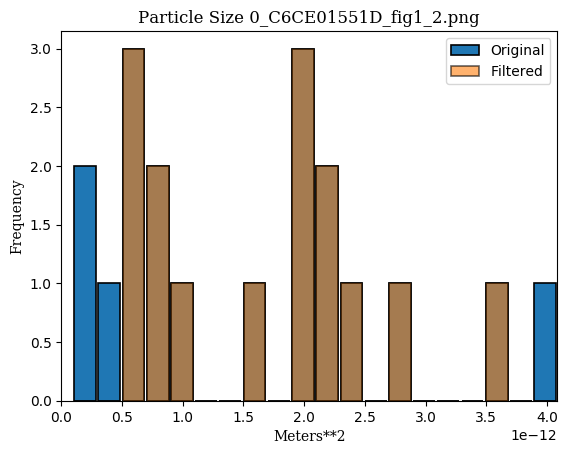
Histogram of Particle Sizes
A histogram of detected particle sizes. The results in blue are contributions deemed to be outliers.
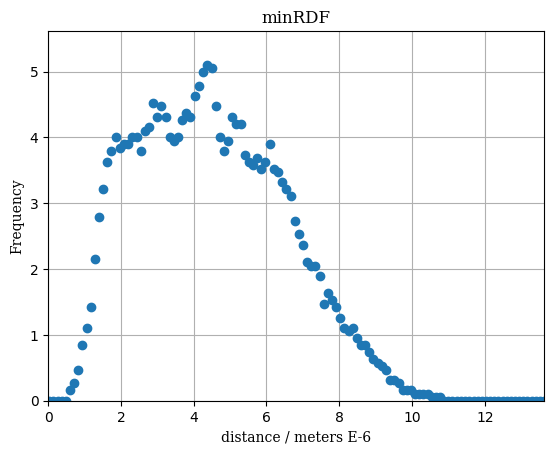
Radial Distribution Function (minimum)
The minimum radial distribution function (minRDF) of detected particles.
This shows the radial distribution function using all extracted particles.